- Sustainable
- Energy Economy
- Energy Services


What is Round Trip Efficiency?

Energy storage systems function by taking in electricity, storing it, and subsequently returning it to the grid. The round trip efficiency (RTE), also known as AC/AC efficiency, refers to the ratio between the energy supplied to the storage system (measured in MWh) and the energy retrieved from it (also measured in MWh). This efficiency is expressed as a percentage (%).
The round trip efficiency is a crucial factor in determining the effectiveness of storage technology. A higher RTE indicates that there is less energy loss during the storage process, resulting in a more efficient overall system. Grid systems engineers strive for energy storage systems to achieve an 80% RTE whenever feasible, as it signifies a desirable level of efficiency and minimizes energy losses.
What Factors Can Affect the Round Trip Efficiency of an Energy Storage System?
The RTE of an energy storage system can be influenced by various factors, including:
1. Technology: Different storage technologies have varying round-trip efficiencies. For example, hydro storage typically ranges from 65% in older installations to 75-80% in modern deployments, while flywheels have efficiencies of about 80% to 90%. Some battery technologies can have round-trip efficiencies ranging from 75% to 90%.
2. Storage duration: Some technologies may experience leakage or energy loss over long-term storage, which can affect round-trip efficiency. It is important to consider the specific characteristics and limitations of the storage technology when evaluating its efficiency.
3. Age and condition of the system: Older storage systems may have lower round-trip efficiencies compared to newer ones. Factors such as wear and tear, component degradation, and maintenance practices can impact the overall efficiency of the system.
4. Charging and discharging rates: The speed at which energy is charged into and discharged from the storage system can affect its efficiency. Certain technologies may have lower efficiencies at high charging or discharging rates.
5. System design and control: The design and control strategies implemented in the energy storage system can influence its round-trip efficiency. Optimal system design, efficient power electronics, and effective control algorithms can improve the overall efficiency of the system.
6. Temperature: Temperature can have an impact on the performance and efficiency of energy storage systems. Extreme temperatures can affect the efficiency of certain storage technologies, such as batteries, leading to lower round-trip efficiencies.
Considering these factors is crucial when evaluating the round-trip efficiency of an energy storage system, as they can significantly affect its performance and effectiveness in storing and retrieving energy.
Must Read: What is Power Conversion Efficiency?

Elliot is a passionate environmentalist and blogger who has dedicated his life to spreading awareness about conservation, green energy, and renewable energy. With a background in environmental science, he has a deep understanding of the issues facing our planet and is committed to educating others on how they can make a difference.
Related Posts
 Content?")
What is Post-Consumer Recycled (PCR) Content?
?")
What is Heating Seasonal Performance Factor (HSPF)?
?")
What is Annual Fuel Utilization Efficiency (AFUE)?
Save my name, email, and website in this browser for the next time I comment.
Type above and press Enter to search. Press Esc to cancel.
Today in Energy
- Recent articles
- liquid fuels
- natural gas
- electricity
- oil/petroleum
- production/supply
- consumption/demand
- exports/imports
- international
- forecasts/projections
- steo (short-term energy outlook)
Utility-scale batteries and pumped storage return about 80% of the electricity they store
Electric energy storage is becoming more important to the energy industry as the share of intermittent generating technologies, such as wind and solar, in the electricity mix increases. Electric energy storage helps to meet fluctuating demand, which is why it is often paired with intermittent sources. Storage technologies include batteries and pumped-storage hydropower , which capture energy and store it for later use. Storage metrics can help us understand the value of the technology. Round-trip efficiency is the percentage of electricity put into storage that is later retrieved. The higher the round-trip efficiency, the less energy is lost in the storage process. According to data from the U.S. Energy Information Administration (EIA), in 2019, the U.S. utility-scale battery fleet operated with an average monthly round-trip efficiency of 82%, and pumped-storage facilities operated with an average monthly round-trip efficiency of 79%.
EIA’s Power Plant Operations Report provides data on utility-scale energy storage, including the monthly electricity consumption and gross electric generation of energy storage assets, which can be used to calculate round-trip efficiency. The metrics reviewed here use the finalized data from the Power Plant Operations Report for 2019—the most recent year for which a full set of storage data is available.
Pumped-storage facilities are the largest energy storage resource in the United States. The facilities collectively account for 21.9 gigawatts (GW) of capacity and for 92% of the country’s total energy storage capacity as of November 2020.
In recent years, utility-scale battery capacity has grown rapidly as battery costs have decreased. As batteries have been increasingly paired with renewables , they have become the second-largest source of electricity storage. As of November 20, 2020, utility-scale battery capacity had 1.4 GW of operational capacity. Another 4.0 GW of battery capacity is scheduled to come online in 2021, according to EIA’s Preliminary Electric Generator Inventory .
Although battery storage has slightly higher round-trip efficiency than pumped storage, pumped-storage facilities typically operate at utilization factors that are currently twice as high as batteries. Increasing durations among battery applications could shift battery operations toward services that reward longer output periods. For example, in 2015, the weighted average battery duration was a little more than 46 minutes, but by 2019, weighted average battery durations had doubled to 1.5 hours. The role of batteries and their capability to provide high levels of round-trip efficiency may become more important as batteries continue to be deployed and as the intermittent renewables share of the electricity mix grows.
Tags: storage , electricity
- POWER Plant ID
- POWER Events
- Connected Plant
- Distributed Energy
- International
- COVID-19 Coverage
- Carbon Capture
- Climate change
- Cybersecurity
- Distributed Power
- Electric Vehicles
- Energy Storage
- Environmental
- Instrumentation & Controls
- Legal & Regulatory
- Legislative
- Ocean/Marine
- Physical security
- Plant Design
- Power Demand
- Research and Development
- Supply Chains
- Tidal Power
- Waste to Energy
- About POWER
- Privacy Policy
- Cookie Settings
- Diversity, Equity, Inclusion & Belonging
- Accessibility Statement
Don’t Neglect Round-Trip Efficiency and Cost of Charging When Considering Levelized Cost of Storage
The world is moving toward renewable sources for electricity generation in an attempt to reduce fossil-fuel reliance. But wind and solar can’t provide a consistent flow of power 24/7, and grid operators have realized that new electricity generation needs to be paired with storage to manage periods with no sun or wind.
The decreasing cost of lithium-ion batteries has made battery energy storage systems (BESS) more affordable; however, the cost of battery storage systems represents only 20%-25% of any project’s lifetime cost. Power equipment, land, site work, cabling, project design and management, grid integration, transportation, and other related up-front costs represent another 25%.
So, what makes up the other ~50%? Operations and maintenance, otherwise known as O&M, represent a few percentage points. O&M generally includes expenses associated with maintaining, repairing, and operating energy storage systems over their lifespan. The rest comes from the cost of electricity to charge the system, which is significantly affected by the system’s overall round-trip efficiency (RTE).
Why RTE and Cost of Energy Matter
Levelized cost of storage (LCOS) is a metric used to determine the cost per unit of energy discharged from an energy storage system. The calculation is usually expressed in dollars per megawatt hour (MWh) and includes initial costs plus operating costs divided by the energy discharged over the asset’s service life.

There are dozens of potential variables that may be used to determine the true levelized cost of storage, and different vendors will add, omit, or adjust different ones to put their products in the best light. This is why it’s so important to understand the role of RTE and cost of energy in a storage system, because they often have the biggest impact. These are also components that vendors with low-RTE technologies will most often discount (or omit altogether).
Round-trip efficiency is a measure of the amount of energy put into a system compared to the amount dispatched, and is expressed as a percentage. A system with a high RTE (75%+) is able to dispatch most of the energy fed into it. A low RTE indicates that the system loses a considerable amount of energy, often to heat arising from irreversible side reactions or high internal cell resistance. Many long-duration energy storage systems have RTEs below 50%, creating a significant amount of energy waste.
For example, lithium-ion batteries generally have RTEs of 90%+. In contrast, lead-acid batteries have lower RTEs of around 70%, meaning that approximately 30% of charge energy is lost. RTEs for flow batteries can range from 50%–75%, while metal-air batteries could have RTEs as low as 40%.
If the electricity used to charge low-RTE batteries was free, efficiency might not matter much. But electricity always comes with a cost. Some might argue that during periods where supply exceeds demand, renewables could be used to charge batteries when they would otherwise be curtailed. There’s a logic to that, but curtailment periods can’t always be predicted.
Even if you’re using electricity that would otherwise be curtailed, you have to assign a monetary value. If a turbine is spinning or a solar panel is generating electricity and a battery system is storing that electricity, every component in the system is subject to normal wear and tear plus maintenance and replacement protocols—all of which have costs associated. Factors at play include:
Technology lifespan and degradation rate. An energy storage system’s service life is determined by technology and cycles. All energy storage systems deteriorate over time, making them less efficient at storing and discharging energy. The same goes for generation sources. From solar to wind to flow batteries to lithium-ion, the more the components are used, the shorter the lifespan and the sooner the need for repair, replacement or augmentation.
Maintenance costs. Solar panels, wind turbines, battery systems, transmission lines, and power equipment all have to be maintained. The more they’re used, the more often components need to be serviced or replaced.
Long-Duration Doesn’t Always Mean Lower LCOS
The latest buzzy term in the energy space is “long-duration energy storage,” or LDES for short. While there’s no single definition of what the term means, the term has generally come to describe a non-lithium storage technology that can provide energy for anywhere from 8 to 160 hours at a lower installed cost per MW than lithium-ion batteries or a standard natural gas turbine.
LDES isn’t confined to battery storage; non-battery technologies include compressed air, latent heat, flywheels, and more. In fact, pumped hydro currently accounts for the vast majority of all LDES capacity in the US, and will likely remain in that position for an extended time. Battery technologies being positioned for LDES use include flow batteries, zinc-based chemistries, metal air, nickel hydrogen, and more.
These technologies all work well and are generally safer than lithium-ion batteries, but they come with trade-offs. Many have high up-front costs and must be amortized over 30–40-year periods to be cost competitive. Some have very low energy densities, requiring significant amounts of land for installations above a few megawatt hours. Some are rate-limited and can’t discharge as quickly as needed for specific applications. Some have very restricted siting requirements. And maybe most importantly, many have RTEs below 60%, with a few at 40% or lower.
So, what does this all mean? The race is on to build a better storage system, and with no universal standard for calculating LCOS, every vendor is using a model that plays to the strength of their own technology. If you’re investigating a new storage technology, be sure to ask a few questions when LCOS numbers come up, such as:
How many years are they calculating when it comes to system life? Lithium-ion batteries usually have to be augmented or replaced somewhere between 10 and 15 years of use; vendors with low densities or high installed costs may calculate over 30–40 years to lower their LCOS while factoring in two or more replacement cycles for lithium-ion.
What are they using for the cost of electricity to charge the system, and how does that compare with your actual costs? Even if you’re only planning to charge the system during periods you’d normally be curtailing renewables, remember that there’s still a cost to running those systems. A system with a low RTE may end up having a much higher LCOS even when you’re paying very little for electricity.
Are they including the cost of land in their calculations? If you’re installing a storage facility in a rural area where land is cheap, this may not matter so much. But if you need to place storage in or near a high-cost-of-living area, cost of land (and availability) could be one of your primary concerns and should definitely play a role in the LCOS calculation.
Are they including installation tax credits (ITCs) or production tax credits (PTCs) in their calculations? If so, be sure that the numbers are correct for your projects, and that the same are being applied to any other technologies you’re evaluating.
— Mukesh Chatter is the CEO of Alsym Energy , a technology company developing a low-cost, high-performance rechargeable battery chemistry that is free of lithium and cobalt.
SHARE this article
Empowering Innovations: The Bright Future of Round Trip Efficiency of Battery
Round Trip Efficiency of Battery
The concept of round trip efficiency of battery is pivotal in energy storage technologies. This section will provide an extensive introduction to what round trip efficiency means in the context of batteries. We'll explore its importance in various applications, ranging from small-scale electronics to large-scale energy systems. Understanding the round trip efficiency of battery is essential for assessing the performance and sustainability of these energy storage devices.

The Science Behind Round Trip Efficiency
Delving deeper into the technicalities, this part will explain how the round trip efficiency of battery is determined. It will cover the fundamental principles of battery operation, including charge and discharge cycles, energy losses during these cycles, and how they affect overall efficiency. Factors like temperature, charge rate, and battery age, which significantly impact round trip efficiency, will be discussed in detail.
Components Affecting Round Trip Efficiency
In this subsection, we will explore the various components of batteries, such as electrodes, electrolytes, separators, and casings, and how each contributes to or detracts from the round trip efficiency. The material composition of these components, their engineering, and how they interact with each other play a critical role in the efficiency of the battery.
The Role of Battery Design
This part will discuss how the physical and chemical design of a battery influences its round trip efficiency. Topics like battery size, shape, internal architecture, and the arrangement of cells within a battery pack will be covered. The section will also explore how innovative design strategies are being employed to enhance efficiency.
Types of Batteries and Their Round Trip Efficiency
This section will provide a comparative analysis of different battery types, such as lithium-ion, lead-acid, and nickel-metal hydride, focusing on their round trip efficiencies. Each battery type's unique characteristics, advantages, and limitations in terms of efficiency will be discussed.
Lithium-Ion Batteries and Efficiency
Focusing on lithium-ion batteries, this subsection will delve into why they are widely regarded for their high round trip efficiency. We will examine the factors that contribute to this efficiency and the challenges that still exist. The latest advancements in lithium-ion technology aimed at improving efficiency will also be highlighted.
Other Battery Technologies
This part will look at alternative battery technologies, comparing their round trip efficiencies with that of lithium-ion batteries. It will cover emerging technologies like solid-state batteries, flow batteries, and others, discussing their potential to rival or surpass the efficiency of traditional battery types

Improving the Round Trip Efficiency of Battery
This section will explore the various strategies and technological advancements aimed at enhancing the round trip efficiency of battery. It will cover research and development efforts in new materials, battery chemistry, and manufacturing techniques. Discussion will include how these advancements could potentially increase efficiency, reduce costs, and extend the life of batteries.
Innovations in Battery Materials
Delving into the realm of materials science, this subsection will explore new and innovative materials being developed to increase the round trip efficiency of battery. This includes advancements in electrode materials, electrolyte formulations, and separator technologies. We'll look at how these new materials can reduce energy losses during charging and discharging, thereby improving overall efficiency.
The Future of Battery Efficiency
In this part, we will explore the cutting-edge research and future directions aimed at pushing the boundaries of round trip efficiency in battery technology. This will include a discussion on potential breakthroughs, the challenges researchers face, and the implications these advancements could have on the global energy landscape.
Applications and Importance of High Round Trip Efficiency
Discussing the wide range of applications where high round trip efficiency in batteries is critical, this section will cover areas like electric vehicles, renewable energy storage, grid management, and consumer electronics. We'll explore how improvements in battery efficiency can impact these fields, leading to more sustainable and efficient energy usage.
Impact on Electric Vehicles
Focusing on electric vehicles (EVs), this subsection will discuss how the round trip efficiency of battery affects the performance, range, and cost-effectiveness of EVs. We'll explore current challenges, the importance of efficiency improvements in the context of EV adoption, and how advancements could shape the future of transportation.
Renewable Energy Storage Systems
In this part, the role of battery efficiency in the effectiveness and viability of renewable energy storage systems will be examined. We'll discuss how higher round trip efficiency can enhance the storage and release of energy from sources like solar and wind, making renewable energy more reliable and accessible.

Battery Round Trip Efficiency Definition: Understanding the Concept
The definition of battery round trip efficiency is a fundamental concept in the realm of battery technology and energy storage. This section aims to elucidate the battery round trip efficiency definition and its relevance in practical applications.
Exploring the Battery Round Trip Efficiency Definition
Battery round trip efficiency is defined as the ratio of the energy output of a battery to the energy input required to recharge it. This definition provides a quantitative measure of how effectively a battery stores and then releases the energy put into it. It's a critical parameter for evaluating the performance of a battery, as it directly influences the efficiency and cost-effectiveness of the battery in its practical application.
Implications of Battery Round Trip Efficiency in Energy Systems
Understanding the battery round trip efficiency definition is vital for anyone involved in the design, manufacture, or use of battery systems. This efficiency metric is particularly important in applications where energy conservation and efficiency are paramount, such as in electric vehicles, renewable energy systems, and portable electronic devices. A higher round trip efficiency means more of the stored energy is available for use, which is crucial for the overall efficiency and sustainability of these systems.
Environmental Impact of Battery Efficiency
This new section will explore the environmental implications of the round trip efficiency of battery. It will discuss how increased efficiency can lead to reduced energy waste and lower carbon footprints. This part will also cover the lifecycle of batteries, including manufacturing and recycling processes, and how efficiency plays a role in minimizing environmental impact.
Economic Aspects of Battery Efficiency
In this section, we'll delve into the economic aspects of round trip efficiency in batteries. It will cover how higher efficiency can lead to cost savings for consumers and businesses, and its impact on the overall economy. This part will also discuss the investment in research and development for more efficient batteries and how this drives innovation in the battery industry.
Safety and Reliability Concerns
This part will address how the round trip efficiency of battery relates to their safety and reliability. We'll explore the challenges that arise when trying to balance high efficiency with safety, especially in high-demand applications like electric vehicles and energy storage systems. This section will also discuss the measures taken to ensure that efficiency improvements do not compromise the safety and longevity of batteries.
Regulatory and Policy Frameworks
This new section will examine the role of regulatory and policy frameworks in shaping the development and adoption of efficient battery technologies. It will cover current regulations and standards related to battery efficiency, and how these policies impact the industry. Additionally, this part will discuss potential future policies that could encourage or mandate improvements in battery efficiency.

BatteryRound Trip Efficiency Calculation: Methods and Importance
The calculation of battery round trip efficiency is a critical aspect in assessing the performance of battery systems. This section delves into the methodologies and significance of accurately performing batteryround trip efficiency calculation.
Understanding the Basics of Battery Round Trip Efficiency Calculation
To begin with, battery round trip efficiency calculation involves determining the ratio of the energy outputted by the battery to the energy inputted into it during charging. This calculation is crucial for understanding how much energy is lost in the process of charging and discharging a battery. These energy losses typically occur due to factors like internal resistance, heat generation, and the inefficiencies in the battery's chemical processes.
Step-by-Step Process of Battery Round Trip Efficiency Calculation
To calculate battery round trip efficiency, one must first measure the amount of energy inputted into the battery during the charging process. This is typically done in watt-hours (Wh) or kilowatt-hours (kWh). Following this, the energy outputted by the battery during discharge is measured. The round trip efficiency is then calculated by dividing the energy outputted by the energy inputted and multiplying the result by 100 to obtain a percentage. A higher percentage indicates a more efficient battery with less energy loss.
The Significance of Accurate Calculation
Accurate battery round trip efficiency calculation is crucial for several reasons. Firstly, it allows for the comparison of different battery technologies on a uniform basis, aiding in the selection of the most efficient and suitable battery for a specific application. Secondly, understanding the efficiency of a battery helps in estimating its operational costs and its impact on the overall efficiency of the system it powers, such as an electric vehicle or a renewable energy storage system.

Battery Storage Round Trip Efficiency: Key Aspects and Evaluation
The concept of battery storage round trip efficiency is crucial in the context of energy storage systems. This section focuses on defining and understanding the nuances of battery storage round trip efficiency and its impact on energy storage solutions.
Defining Battery Storage Round Trip Efficiency
Battery storage round trip efficiency is a measure that indicates how efficiently a battery can store and then release the energy it has been charged with. This efficiency is calculated by comparing the amount of energy input into the battery during charging to the amount of usable energy output during discharge. A higher battery storage round trip efficiency signifies that a larger portion of the input energy is available for use, making the battery more effective and economical for energy storage purposes.
Importance of Battery Storage Round Trip Efficiency in Energy Systems
In the field of energy storage, especially in systems like grid storage or electric vehicles, battery storage round trip efficiency plays a pivotal role. It directly affects the viability and performance of the storage system. High-efficiency levels mean more energy is available for use from each charging cycle, which is crucial for the overall energy efficiency and operational cost of the system. As such, battery storage round trip efficiency is a key parameter in the selection and design of battery systems for various applications.
Round Trip Efficiency Battery Storage: A Brief Overview
The term roundtrip efficiency in battery storage is a vital metric in the energy sector. This section provides a succinct overview of what round trip efficiency battery storage entails and its significance.
Understanding RoundTrip Efficiency Battery Storage
Round trip efficiency in battery storage refers to the measure of how effectively a battery can store and then return the energy that is put into it. It is a crucial indicator of a battery's performance, affecting the viability and efficiency of energy storage systems. This efficiency is especially important in applications where energy conservation and effective storage are key, such as in renewable energy systems and electric vehicles.
The Role of Round Trip Efficiency in Battery Storage Systems
The significance of roundtrip efficiency battery storage cannot be overstated. It directly influences how much stored energy is actually usable, impacting the overall effectiveness and cost-efficiency of the storage system. High round trip efficiency battery storage means more energy is available for use, reducing waste and improving the sustainability of the system.
Round Trip Efficiency of Battery Formula: Essential Calculation
The round trip efficiency of battery formula is a fundamental equation in battery technology. This section is dedicated to explaining the round trip efficiency of battery formula and its application in measuring battery performance.
The Basic RoundTrip Efficiency of Battery Formula
At its core, the roundtrip efficiency of battery formula involves a simple calculation: dividing the energy output of the battery (measured in watt-hours or kilowatt-hours) by the energy input required to charge the battery, and then multiplying by 100 to express it as a percentage. This formula is critical for determining how much energy a battery can effectively use out of the total energy it consumes during the charging process.
Practical Applications of the Formula
In practical terms, the round trip efficiency of battery formula is used extensively by engineers and technicians to assess the performance of different types of batteries. This formula helps in comparing the efficiency of various battery technologies and designs, playing a crucial role in battery research and development. A higher percentage obtained from this formula indicates a more efficient battery, with less energy lost during charging and discharging cycles.
The round trip efficiency of battery formula is not just a theoretical tool; it has significant practical implications in the development and selection of batteries for various applications, from small electronics to large-scale energy storage systems.

Tesla Battery Round Trip Efficiency: Insights into Performance
Tesla battery round trip efficiency is a key metric that highlights the effectiveness of Tesla's battery technology. This section aims to shed light on the specifics of Tesla battery round trip efficiency and its implications.
Understanding Tesla Battery Round Trip Efficiency
Tesla battery round trip efficiency refers to the efficiency with which Tesla's batteries can store and then release energy. This efficiency is a critical aspect of Tesla's battery technology, reflecting how much energy is retained and available for use after charging. The higher the round trip efficiency, the more effective the battery is at minimizing energy losses during charge and discharge cycles.
Significance of Tesla Battery Round Trip Efficiency in Electric Vehicles
Tesla battery round trip efficiency is particularly important in the context of their electric vehicles (EVs). High round trip efficiency means that more of the energy stored in the vehicle's battery is available for driving, enhancing the vehicle's range and overall performance. Tesla's focus on optimizing battery round trip efficiency has been a significant factor in their EVs' success, as it directly impacts driving range, charging times, and the overall user experience.
Frequently Asked Questions (FAQs) About Battery Efficiency
What is Round Trip Efficiency of Battery?
Round trip efficiency of a battery refers to the measure of how effectively a battery can store and then release the energy that is put into it during charging. It is calculated by dividing the energy output during discharge by the energy input during charging, then multiplying by 100 to get a percentage. A higher value indicates that the battery is more efficient, losing less energy in the process of charging and discharging.
How Does Temperature Affect Battery Efficiency?
Temperature can significantly impact the efficiency of a battery. Extreme temperatures, both hot and cold, can affect the chemical reactions within a battery, thereby impacting its ability to store and release energy efficiently. Typically, high temperatures can accelerate degradation, while low temperatures can reduce the battery's effective capacity.
Can the Round Trip Efficiency of a Battery Improve Over Time?
Generally, the round trip efficiency of a battery decreases over time as the battery undergoes wear and tear from repeated charging and discharging cycles. However, advancements in battery technology, materials, and management systems can lead to improvements in newer batteries. Ongoing research is focused on developing batteries with longer lifespans and better efficiency retention over time.
What Factors Influence the Round Trip Efficiency of Electric Vehicle Batteries?
Several factors influence the round trip efficiency of electric vehicle (EV) batteries. These include the battery's chemical composition, design, the efficiency of the battery management system, and operational conditions such as temperature and charging habits. Additionally, the way the vehicle is driven and the efficiency of other vehicle systems can also impact the overall round trip efficiency of the battery.
Conclusion: The Future of Round Trip Efficiency in Battery
This concluding section will summarize the critical importance of round trip efficiency in batteries, reflecting on the discussed topics. It will envision the future of battery technology with a focus on efficiency, considering the potential impacts on various industries, the environment, and society at large.
Round Trip Efficiency
Energy Storage System Efficiency

Related Posts
Xiaomi electric vehicle: embrace superior safety and extraordinary efficiency, carbon capture and storage india: essential strategies for environmental excellence, best energy-efficient light bulbs 2024, lithium ion battery efficiency over time: unveiling the astonishing longevity secrets.
Type above and press Enter to search. Press Esc to cancel.
Sign In or Register
Welcome back.
Login to your account below.
This is the UK domain, to see the EU or other regions, please click below
- Visit the GivEnergy cloud
- All in One – battery plus inverter
- AC coupled inverter
- Hybrid inverter
- Battery storage
- Full energy ecosystem overview
- Start your journey
- Power conversion system (PCS)
- Battery packs
- Commercial battery rack
- SME battery system
- Battery storage container
Energy management software
- GivEnergy app
- GivEnergy portal
- Home battery storage
- Commercial battery storage
- Sustainable construction projects
- Social housing project
- Wholesalers
- Energy suppliers – E.ON partner
- Energy suppliers – Octopus
- Energy aggregators
- Solar industry – Open Solar
- Solar industry – Easy PV
- Giv-Gallery
- Case studies
- Support hall of fame
- Why choose GivEnergy?
- Refer a friend
- Find a distributor
- Knowledge base
- Community forum
Documentation
- Resource hub
- Product brochure 2024
- GivEnergy API
- Server status
- View all posts

‘Why are home batteries so expensive?’ A few things you...

IP20 rated vs IP65 rated: what’s the difference?

📢 Exciting leadership announcement for GivEnergy 📢
- FIND AN INSTALLER
- Home-owners

- January 30, 2024
- Blog , Commercial battery storage , Domestic battery storage , Explain like I’m 5
What is round trip efficiency in battery storage?
Round trip efficiency (RTE) is a measure of how efficiently a battery can store and discharge energy. Find out why it’s crucial in the world of BESS.
Terminology in the world of battery storage can seem daunting to the average Joe.

Luckily, we’re here to help.
Round trip efficiency (RTE) is something you may have come across in relation to batteries.
In a nutshell, RTE measures how efficiently a battery can store and discharge energy.
How is RTE calculated? Why are there no batteries with 100% RTE? How has RTE in storage batteries improved in recent years?
Read on to find the answers to these questions.
How to calculate the RTE of a battery?
The RTE of a battery can be calculated as a percentage using a simple formula shown below:
Energy output ÷ energy input x 100 = RTE
Let’s demonstrate what this means in practical terms with an example.
Mrs Jones installs a storage battery for her home . As she and her family typically use 10 kWh of electricity per day, she opts for a 10 kWh storage battery.
As someone who is both eco-conscious and has an above-average income, Mrs Jones installs both solar panels and a wind turbine to power her battery storage system. This means she can charge her 10 kWh battery from renewable sources.

However, Mrs Jones soon realises that she isn’t getting 10 kWh per day from her storage battery.
In reality, she gets 8 kWh per day. That’s because her 10 kWh battery has 80% round trip efficiency.
If she had opted for a 10 kWh battery with 90% round trip efficiency, she would get… yep… 9 kWh per day.
For her remaining 2 kWh per day of electricity needs, she draws energy from the grid.
Why do batteries lose energy?
Unfortunately, batteries always lose a small amount of energy during operation.
This is usually because of heat loss, self-discharge, high internal cell resistance or other factors.
Are there any batteries with 100% RTE?
You can think of it like this: if anyone ever tries to sell you a 100% RTE battery, run a mile because they’re almost certainly lying.
What is the RTE of a typical battery?
RTE varies among different types of storage batteries .

For older battery systems, 80% round trip efficiency would have been considered a good standard. Some evidence suggests the typical lithium-ion battery – a popular choice for modern battery energy storage systems and electric vehicles – has round trip efficiency of around 83%.
GivEnergy’s own batteries – using LiFePO4 (lithium iron phosphate) – have achieved 93% round trip efficiency .
RTE – not to be ignored
Grid-level battery storage is becoming increasingly common to accommodate the growth in renewables, especially solar and wind.

Round trip efficiency is a factor that decision-makers need to take into account when assessing the overall efficiency of an energy storage system.
And it’s something YOU also need to bear in mind when installing your own battery storage system for your home or business.
Remember: 100% round trip efficiency is a lie! However, 93% round trip efficiency with a GivEnergy battery using LiFePO4 technology is not a lie.
Looking to play your part in the energy storage revolution? Get started by finding an approved GivEnergy installer today.
Further reading
- Explain like I’m 5: depth of discharge
- LiFePO4 battery: what is it & why is it best for BESS?
- The superior choice: embracing LiFePO4 batteries over NMC technology
Quick Links
Getting started with...

Product images used are for illustrative purposes. The finished setup will vary from installation to installation, and will include all your needed cable connections, metering, any (outdoor) canopies, etc.
Utility-Scale Battery Storage
The 2022 ATB represents cost and performance for battery storage across a range of durations (2–10 hours). It represents lithium-ion batteries (LIBs)—focused primarily on nickel manganese cobalt (NMC) and lithium iron phosphate (LFP) chemistries—only at this time, with LFP becoming the primary chemistry for stationary storage starting in 2021. There are a variety of other commercial and emerging energy storage technologies; as costs are well characterized, they will be added to future editions of the ATB.
The National Renewable Energy Laboratory's (NREL's) Storage Futures Study examined energy storage costs broadly and specifically the cost and performance of LIBs (Augustine and Blair, 2021) . The costs presented here (and for distributed residential storage and distributed commercial storage) are based on this work. This work incorporates base year battery costs and breakdowns from (Ramasamy et al., 2021) , which works from a bottom-up cost model. We would note though that, during the elapsed time between the calculations for the Storage Futures Study and this ATB release, updated values have been calculated as more underlying data have been collected. Though these changes are currently small, we recommend using the data presented here in the ATB rather than what was previously published with the Storage Futures Study.
Base year costs for utility-scale battery energy storage systems (BESS) are based on a bottom-up cost model using the data and methodology for utility-scale BESS in (Ramasamy et al., 2021) . The bottom-up BESS model accounts for major components, including the LIB pack, inverter, and the balance of system (BOS) needed for the installation. Using the detailed NREL cost models for LIB, we develop base year costs for a 60-MW BESS with storage durations of 2, 4, 6, 8, and 10 hours, shown in terms of energy capacity ($/kWh) and power capacity ($/kW) in Figure 1 and Figure 2 respectively. Base year installed capital costs for BESS in terms of $/kWh decrease with duration, and costs in $/kW increase. This inverse behavior is observed for all energy storage technologies and highlights the importance of distinguishing the two types of battery capacity when discussing the cost of energy storage.

Figure 1. 2021 U.S. utility-scale LIB storage costs for durations of 2–10 hours (60 MW DC ) in $/kWh
EPC: engineering, procurement, and construction

Figure 2. 2021 U.S. utility-scale LIB storage costs for durations of 2–10 hours (60 MW DC ) in $/kW
Scenario Descriptions
Battery cost and performance projections in the 2022 ATB were based on a literature review of 13 sources published in 2018 or 2019, as described by Cole et al. (Cole et al., 2021) . Three projections from 2020 to 2050 are developed for scenario modeling based on this literature.
In all three scenarios of the scenarios described below, costs of battery storage are anticipated to continue to decline. The Storage Futures Study (Augustine and Blair, 2021) describes that the majority of this cost reduction comes from the battery pack cost component with minimal cost reductions in BOS, installation, and other components of the cost. The report indicates that NREL, BloombergNEF ( BNEF ), and others anticipate that the growth of the overall battery industry - across the consumer electronics sector, the transportation sector, and the electric utility sector - will lead to cost reductions. Additionally, BNEF and others indicate that changes in lithium-ion chemistry (such as switching away from cobalt) will also reduce cost. A third key factor is ongoing innovation with significant corporate and public research on batteries. Finally, the growth in the market (effective learning-by-doing) and more diversity of chemistries will expand and change the dynamics of the supply chain for batteries resulting in cheaper inputs to the battery pack (Mann et al., 2022) .
- Conservative Technology Innovation Scenario (Conservative Scenario): The conservative projection is comprised of the maximum projection in 2020, 2025, and 2030 among the 13 cost projections from the literature review (Cole et al., 2021) . Defining the 2050 points is more challenging because only four data sets of the 13 from the literature review extend to 2050; they show cost reductions of 19%, 25%, 27%, and 39% from 2030 to 2050. A 25% cost reduction is assumed for the Moderate and Conservative scenarios. In other words, the Conservative Scenario is assumed to decline by 25% from 2030 to 2050.
- Moderate Technology Innovation Scenario (Moderate Scenario): The moderate projections are taken as the median point in 2020, 2025, and 2030 of the 13 projections reviewed. Defining the 2050 points is more challenging because only four data sets of the 13 from the literature review extend to 2050; they show cost reductions of 19%, 25%, 27%, and 39% from 2030 to 2050. A 25% cost reduction is assumed for the Moderate and Conservative scenarios. In other words, the Moderate Scenario is assumed to decline by 25% from 2030 to 2050.
- Advanced Technology Innovation Scenario (Advanced Scenario): The advanced projections are taken as the lowest cost point in 2020, 2025, and 2030 from the 13 projections reviewed. Defining the 2050 points is more challenging because only four of the reviewed data sets extend to 2050; they show cost reductions of 19%, 25%, 27%, and 39% from 2030 to 2050. The 39% cost reduction is used for the Advanced Scenario. In other words, the Advanced Scenario is assumed to decline by 39% from 2030 to 2050.
Methodology
Projected Utility-Scale BESS Costs: Future cost projections for utility-scale BESS are based on a synthesis of cost projections for 4-hour duration systems in (Cole et al., 2021) and the BNEF cost projections for utility-scale BESS (BNEF, 2019b) (Frith, 2020) . The Cole et al. cost projections are based on a literature survey that includes results from 13 studies of BESS costs. The BNEF cost projections are based on learning rates and deployment projections for utility-scale BESS that are broken down at the system component level. Both projections extend to 2050.
Projected costs for battery components tend to decrease much more quickly than projected costs for other system components such as the inverter, BOS, installation, and soft cost components (EPRI, 2018) (BNEF, 2019b) (BNEF, 2019a) (Schmidt et al., 2018) . Thus, projected total system costs decrease more quickly for longer-duration battery storage than shorter-duration battery storage. However, the duration is not captured in the BNEF cost projections, which only project a 4-hour system. The (Cole et al., 2021) projections contain information for both power and duration, so costs can be calculated for any storage duration; however, they do not account for how different BESS component costs (particularly, the LIB pack cost) change over time. Therefore, to account for storage costs as a function of storage duration, we apply the BNEF battery cost reduction projections to the energy (battery) portion of the 4-hour storage and use the (Cole et al., 2021) summary for the remaining component costs to develop combined Moderate Scenario projections for future years. In this way, the cost projections capture the rapid projected decline in battery costs and account for component costs decreasing at different rates in the future. Figure 3 shows the resulting utility-scale BESS future cost projections for the Moderate Scenario for 2–10 hours in terms of both $/kWh and $/kW. For the Advanced and Conservative BESS cost scenarios, we apply the normalized cost reductions for the corresponding scenarios from (Cole et al., 2021) to the base year costs for all storage durations.

Figure 3. Utility-scale BESS Moderate Scenario cost projections, on a $/kWh basis (left) and a $/kW basis (right) Projections assume a 60-MW DC project. Note that 2020 costs correspond to Figure -1 and Figure 2.
Capital Expenditures (CAPEX)
Definition: The bottom-up cost model documented by (Ramasamy et al., 2021) contains detailed cost components for battery only systems costs (as well as combined with PV). Though the battery pack is a significant cost portion, it is a minority of the cost of the battery system. These costs for a 4-hour utility-scale stand-alone battery are detailed in Table 1.
Figure 4. Cost Details for Utility-Scale Storage (4-Hour Duration, 240-MWh usable)
Current Year (2021) : The 2021 cost breakdown for the 2022 ATB is based on (Ramasamy et al., 2021) and is in 2020$.
Within the ATB Data spreadsheet, costs are separated into energy and power cost estimates, which allows capital costs to be constructed for durations other than 4 hours according to the following equation:
Total System Cost ($/kW) = Battery Pack Cost ($/kWh) × Storage Duration (hr) + BOS Cost ($/kW)
For more information on the power versus energy cost breakdown, see (Cole et al., 2021) . For items included in CAPEX, see the table below.
Components of CAPEX
Future Projections : Future projections are based on the same literature review data that inform (Cole et al., 2021) , which generally used the median of published cost estimates to develop a Moderate Technology Cost Scenario and the minimum values to develop an Advanced Technology Cost Scenario. However, as the battery pack cost is anticipated to fall more quickly than the other cost components (which is similar to the recent history of PV system costs), the battery pack cost reduction is taken from (BNEF, 2019b) and (Frith, 2020) and is reduced more quickly. This tends to make the longer-duration batteries (e.g., 10 hours ) decrease more quickly while shorter-duration batteries (e.g., 2 hours) decrease less quickly into the future. All durations trend toward a common trajectory as battery pack costs decrease into the future.
Operation and Maintenance (O&M) Costs
Base Year : (Cole et al., 2021) assume no variable O&M (VOM) costs. All operating costs are instead represented using fixed O&M (FOM) costs. The fixed O&M costs include battery replacement costs, based on assumed battery degradation rates that drive the need for 20% capacity augmentations after 10 and 20 years to return the system to its nameplate capacity (Ramasamy et al., 2021) . The augmentations assume that 20% of the cells are replaced in each augmentation, with costs for battery cells and bidirectional inverters dropping 40% in the next 20 years. In the 2022 ATB, FOM is defined as the value needed to compensate for degradation to enable the battery system to have a constant capacity throughout its life. According to the literature review (Cole et al., 2021) , FOM costs are estimated at 2.5% of the capital costs in dollars per kilowatt. Items included in O&M are shown in the table below.
Components of O&M Costs
Future Years : In the 2022 ATB, the FOM costs and the VOM costs remain constant at the values listed above for all scenarios.
Capacity Factor
The cost and performance of the battery systems are based on an assumption of approximately one cycle per day. Therefore, a 4-hour device has an expected capacity factor of 16.7% (4/24 = 0.167), and a 2-hour device has an expected capacity factor of 8.3% (2/24 = 0.083). Degradation is a function of this usage rate of the model and systems might need to be replaced at some point during the analysis period. We use the capacity factor for a 4-hour device as the default value for ATB due to anticipation that 4-hour durations are more typical in the utility-scale market.
Round-Trip Efficiency
Round-trip efficiency is the ratio of useful energy output to useful energy input. (Mongird et al., 2020) identified 86% as a representative round-trip efficiency, and the 2022 ATB adopts this value. In the same report, testing showed 83-87%, literature range of 77-98%, and a projected increase to 88% in 2030.
The following references are specific to this page; for all references in this ATB, see References .
Augustine, Chad, and Nate Blair. “Energy Storage Futures Study: Storage Technology Modeling Input Data Report.” Golden, CO: National Renewable Energy Laboratory, 2021. https://www.nrel.gov/docs/fy21osti/78694.pdf .
Ramasamy, Vignesh, David Feldman, Jal Desai, and Robert Margolis. “U.S. Solar Photovoltaic System and Energy Storage Cost Benchmarks: Q1 2021.” Golden, CO: National Renewable Energy Laboratory, 2021. https://www.nrel.gov/docs/fy22osti/80694.pdf .
Mann, Margaret, Vicky Putsche, and Benjamin Sharger. “Grid Energy Storage: Supply Chain Deep Dive Assessment.” Washington, D.C.: U.S. Department of Energy, February 24, 2022. https://www.energy.gov/policy/securing-americas-clean-energy-supply-chain .
Cole, Wesley, Will A. Frazier, and Chad Augustine. “Cost Projections for Utility-Scale Battery Storage: 2021 Update.” Technical Report. Golden, CO: National Renewable Energy Laboratory, 2021. https://www.nrel.gov/docs/fy21osti/79236.pdf .
EPRI. “Energy Storage Technology and Cost Assessment: Executive Summary.” Electric Power Research Institute, 2018.
Schmidt, Oliver, Sylvain Melchior, Adam Hawkes, and Iain Staffell. “Update 2018: The Future Cost of Electrical Energy Storage Based on Experience Rates.” Figshare, 2018. https://figshare.com/articles/Update_2018_-_The_future_cost_of_electrical_energy_storage_based_on_experience_rates/7012202 .
BNEF. “Energy Storage System Costs Survey 2019.” BloombergNEF, October 14, 2019a.
BNEF. “2019 Long-Term Energy Storage Outlook.” BloombergNEF, July 31, 2019b. https://www.bnef.com/core/insights/21113 .
Frith, James. “Energy Storage System Costs Survey 2020.” Bloomberg New Energy Finance, December 16, 2020.
Mongird, Kendall, Vilayanur Viswanathan, Jan Alam, Charlie Vartanian, Vincent Sprenkle, and Richard Baxter. “2020 Grid Energy Storage Technology Cost and Performance Assessment.” Washington, D.C.: U. S. Department of Energy, December 2020. https://www.energy.gov/energy-storage-grand-challenge/downloads/2020-grid-energy-storage-technology-cost-and-performance .

- ORIENTATION
- Instructor Information
- RESS PROGRAM
- CREATING A PRESENTATION
- WRITING STYLE GUIDES
- Getting Help
10.2 Key Metrics and Definitions for Energy Storage
Key Metrics and Definitions for Energy Storage
There are a few key technical parameters that are used to characterize a specific storage technology or system. Those characteristics will determine compatibility of the storage with a proposed application and will also have impact on its economic feasibility. Let us go through some definitions.
Storage Capacity
Capacity essentially means how much energy maximum you can store in the system. For example, if a battery is fully charged, how many watt-hours are put in there? If the water reservoir in the pumped hydro storage system is filled to capacity, how many watt-hours can be generated by releasing that water? Those amounts are determined by storage capacity.
Understandably, the capacity of any storage will increase with the system size. The more battery stacks are installed, the more electric energy can be put in for storage. The larger the water reservoir, the greater energy turnaround becomes possible. The system size should be matched with the load and specific application.
Storage capacity is typically measured in units of energy: kilowatt-hours (kWh), megawatt-hours (MWh), or megajoules (MJ). You will typically see capacities specified for a particular facility with storage or as total installed capacities within an area or a country.
Sometimes you will see capacity of storage specified in units of power (watt and its multiples) and time (hours).
For example: 60 MW battery system with 4 hours of storage . What does it mean?
60 MW means that the system can generate electricity at the maximum power of 60 MW for 4 hours straight. That also means that the total amount of energy stored in the system is:
60 MW x 4 hours = 240 MWh
But it can also provide less power if needed. For example, if the load only requires 20 MW, the system can supply it for 12 hours. The total amount of stored energy is the same, but it is used more slowly:
20 MW x 12 hours = 240 MWh
So power and time ratings give us a little bit more information: we not only know how much energy is stored, but can also define at what maximum rate this energy can be potentially used.
Check Your Understanding Questions 1 & 2 (Multiple Choice)
Energy density.
Energy density is often used to compare different energy storage technologies. This parameter relates the storage capacity to the size or the mass of the system, essentially showing how much energy (Wh) can be stored per unit cell, unit mass (kg), or unit volume (liter) of the material or device.
For example, energy densities for different types of batteries are listed in the table below [IES, 2011]:
Of course, we are interested to store as much energy as possible while using as small and light device as possible for this purpose. From the table above we can conclude, for example, that a fully charged Lead-Acid battery will run out of charge much sooner than a fully charged Li-ion battery of the same mass/size.
Energy density is related to capacity and determines the duration of power generation. Also materials with higher energy density help make the power block more compact, which is useful in portable electronics and vehicle applications.
Just for comparison, the energy density of the pumped hydro storage is 0.2—2 Wh/kg, which is rather low and requires significant masses of water and large reservoir size to deliver utility scale power.
Check Your Understanding Question 3 (Multiple Choice)
Power density.
Power density (measured in W/kg or W/liter) indicates how quickly a particular storage system can release power. Storage devices with higher power density can power bigger loads and appliances without going oversize. Imagine an electric vehicle accelerating from 0 to 60 MPH – which takes a lot of power. If you look at the table below, you will see why Li-ion battery remains the technology of choice for powering electric vehicles, even though some other battery types exhibit similar energy densities.

The technologies located in the lower left corner of the diagram (low energy density and low power density) take significant amount of space and material to enable the storage conversion and are mostly suitable for very large scale projects. Systems such as PHS and CAES also rely on the availability of specific landscape and geological features to accommodate the storage reservoirs.
The technologies located in the upper right corner of the diagram are most coveted for portable and efficient power supply, such as electric vehicles. These compact systems can carry a significant amount of energy and release it quickly on demand.
The technologies in the upper left corner are special devices that can be used in quick response electronics. These systems store small amounts of energy (and therefore charging can be fast), but are able to provide high power by releasing energy within short period of time.
Finally, the technologies in the lower right corner are characterized by slow charge and discharge, but the advantage is the total high amount of energy they are able to store, providing longer duration of energy supply.
Check Your Understanding Questions 4 & 5 (Multiple Choice)
Storage efficiency.
The main function of any storage device is to uptake and release power on demand. In case of a battery, for example, it would be electrochemical charge/discharge cycle; in case of pumped hydro storage, this process involves pumping water into the elevated reservoir and later releasing the flow through the turbine. Both charge and discharge processes include one or more energy conversions (Figure 10.3). In the figure, each arrow indicates the energy conversion from one form to another.

Regardless the number of transformations, the energy comes to its initial electric form, which is finally ready to be dispatched into the grid. This is the charge-discharge cycle, the "round trip".
In each conversion, energy is partially lost from the cycle and dissipated into the surroundings, and the efficiency of conversion at every step accounts for those losses.
Efficiencies of all energy conversion steps in this cycle are combined in the metric called round-trip efficiency , which essentially indicates the percentage of energy delivered by the storage system compared to the energy initially supplied to the storage system. The obvious goal is to minimize the conversion losses and thus maximize the overall storage efficiency.
Here are some round-trip efficiencies of various energy storage systems:
These numbers mean the following. For example, out of 1 MWh of energy spent to pump water up to the hydro storage, only 0.7-0.8 MWh will be available to use after the water is released to run the turbine and generator to produce electric power. The other 0.2-0.3 MWh of energy will be converted into non-useful forms of energy and “lost” from the cycle. Some of the energy losses occur in the auxiliary devices used in the energy storage process, very often in the form of waste heat. Furthermore, energy losses may be linked to the mechanical or material losses: for example, leaks and evaporation of water from pumped storage, air leaks in CAES, chemical degradation and incomplete reactions in batteries.
Check Your Understanding Questions 6 & 7 (Multiple Choice)

The Energy Storage Report 2024
Round-trip efficiency is key metric for assessing non-lithium energy storage alternatives, epcs say.

Round-trip efficiency of alternative storage technologies is the standout metric for assessing their potential versus lithium-ion, Energy-Storage.news has heard.
At last month’s RE+ national clean energy industry event, two US-based engineering, procurement and construction (EPC) companies offered their views after evaluating numerous non-lithium technologies.
Enjoy 12 months of exclusive analysis
- Regular insight and analysis of the industry’s biggest developments
- In-depth interviews with the industry’s leading figures
- Annual digital subscription to the PV Tech Power journal
- Discounts on Solar Media’s portfolio of events, in-person and virtual
Or continue reading this article for free
Their suitability for use in stationary energy storage system (ESS) applications hinges on a number of things, such as safety, abundance of materials and established supply chains.
Whereas in the past, there was perhaps a feeling that technology providers had increasingly sophisticated products and solutions without an immediately addressable market opportunity ahead of it, it appears that now the market is looking at non-lithium alternatives more seriously than before.
Factors include the desire to uncouple from existing supply chains: the ESS market still struggles to compete with high volume demand for batteries from the electric vehicle (EV) sector, meaning carmakers often absorb battery production long before their storage counterparts get a look in.
For the US in particular, it could also mean uncoupling from the global industry’s almost total dependency on Chinese manufacturers, materials suppliers and processors, which dominate the lithium battery space.
The US is supporting a domestic lithium battery value chain, but as we heard a while back from experts at three of the country’s network of National Laboratory facilities, it wouldn’t hurt to also explore the possibilities of creating value chains for next generation tech , aka ‘leapfrogging’ the current status quo.
There are many other reasons, such as the threat of thermal runaway. Although fires are exceedingly rare given the growth in deployment of lithium-ion, each fire that occurs increases the perception of risk. Many non-lithium alternatives, even electrochemical technologies like flow batteries, do not go into thermal runaway and pose even less fire risk than lithium batteries do.
Another big thing is that technologies besides lithium might actually be better suited to performing some of the applications stationary storage is increasingly being used for, particularly for those that require long durations of storage far in excess of the 4-hour or even 8-hour projects seen as the upper limits for cost-effective use of lithium battery energy storage system (BESS) technology.
Technology still ahead of market demand
However, the paramount consideration is whether they can store and release energy in an efficient enough way, or do it cheaply enough, to be a viable alternative, according to representatives of US EPC firms Kiewit and Burns & McDonnell.
In a presentation given at the RE+ exhibition’s Storage Central theatre space, Dr Helen Fischer from Kiewitt said that there are six different factors that affect the viability of energy storage technologies.
These factors are related to:
- Technology and performance
- Equipment and materials
- Overall economics
- Geographic requirements
- Whether some or all elements are based on existing, common industry experience
- How readily they can get regulatory backing.
In the first area of technology and performance, Fischer said round-trip efficiency is “the factor that matters when it comes to storage”.
Ben Echeverria, energy storage regulations and compliance expert at Burns & McDonnell, told Energy-Storage.news in an interview that he “absolutely” agreed with Fischer’s view on round-trip efficiency (RTE).
At present, a good RTE for non-lithium resources to even get into the conversation is being able to achieve “about 60% of what lithium can do”. Given that lithium technologies nowadays are routinely getting overall RTE in excess of 90%, versus about 75% for flow batteries, or roughly 80% for pumped hydro energy storage (PHES), it’s quite a steep curve.
That said, for technologies such as PHES, RTE may not matter as much as overall cost over the lifetime of the asset. Makers of newer storage technologies such as Form Energy, which has a 100-hour duration battery made using an iron-air chemistry, may also argue that while they may have RTE in the 70% – 80% range and relatively low energy density, their products can be made cheaply, using abundant raw materials which could play out much better across other metrics.
EPCs don’t tend to choose what types of technology go into projects they work on, it’s the customer’s choice. But the likes of Kiewitt and Burns & McDonnell will keep an eye on emerging technologies to have an understanding of where the market might be going next.
“The challenge that non-lithium really has is round-trip efficiency and the overall energy density,” Ben Echeverria said, while adding that those limitations could indeed be less of a dealbreaker if the technologies can scale.
At the same time, if the market demands them for being able to deliver large capacities of energy and long durations, essentially filling a gap where lithium cannot, or indeed, directly replacing the baseload role of thermal generation, that would also flip the equations on their head.
There is a whole industry ecosystem built around lithium and with costs going down with the scale of production and deployment, “it’s hard to go that route unless there’s a really significant financial use case for it,” Echeverria said.
“We see 2-hour [duration being suited] for a particular market or two, we see 4-hours being more of the generalised setup for the financial viability of energy storage [in the US]. So we’re still looking at this market financially, and, obviously, the power need or power requirement is a part of it, but in order to get someone to develop long-duration storage at scale, there has to be a financial feasibility to it,” Echeverria said.
The energy market doesn’t currently have a “significant need” for long-duration storage, not until large numbers of baseload power plants come offline, he said. The interest seen from the market hasn’t yet reached the same sort of commercial tipping point lithium has done in the last few years.
“Without that need, or without that immediate demand for it, then it just kind of sits over here as a somewhat of a pet project or pilot programme.”
Pilots and trial deployments are themselves no bad thing. Burns & McDonnell project manager Ben Kuisle noted that various utilities across the US are trying out LDES technologies, with Form Energy for example preparing to see its iron-air battery deployed by a number of them, most recently with Dominion Energy in Virginia .
“I think they’re looking at it now to be to be able to flip a switch when the time comes,” Kuisle said, while Kiewit’s Helen Fischer noted that the US government in its support for LDES has created a “commercial adoption readiness” scale to go alongside the more commonly used “technology adoption readiness” scale.

Eku Energy: ‘Shareholders understand balance between merchant and contracted revenues’ in Australia’s NEM

ROUNDUP: Powin HVAC deal, ESS Inc California flow battery, New Zealand’s first 2nd life BESS

LDES deployments in Ireland held back by lack of incentives and market design, report says

Germany’s Eco Stor to start building another 238MWh BESS in November 2024

Lazard: IRA brings LCOS of 100MW, 4-hour standalone BESS down as low as US$124/MWh
Most popular, poland’s 57% de-rating factor for bess would be ‘lethal blow’ to market, belgium’s montea investing €30 million in distributed bess across logistics network, ‘industry still learning about cost, complexity of bess projects’: rwe clean energy on development, epc and supply chain, aes withdraws hybrid solar-plus-storage project from hawaiian electric procurement, email newsletter.
- Advertising
- Terms of Use
- Terms of Sale
- Privacy Policy
- Cookie Policy
Everything you want to know about batteries, and more!
Round Trip Efficiency in Batteries: A Critical Matter

When we depart for a hike in the mountains, we are full of excitement over the gorgeous views that lie ahead. However, when we return home late in the afternoon our energy is exhausted. Even after a good night’s sleep, we are still not fully ourselves. Our round trip has robbed ourselves of something. This happens with battery storage too. We call this phenomenon the “round trip efficiency”.
Comparing Round Trip Efficiency in Energy Storage
Battery storage saves surplus energy by absorbing it, and releasing it later typically to a power grid. However, the process itself expends some of the power. We call the net ratio of power retention round trip efficiency.
This ratio is critical to the success of energy storage, and by definition renewable energy sources too. We would be on the back foot were we to lose too much potential in the process. Energy Mag advises storage batteries are slightly behind flywheels that have 80 to 90% round trip efficiency. However, batteries are catching up with 75 to 90%, and every month science gains more traction.
Using Battery Storage to Manage Grid Loading
Grid managers face the challenge of matching supply and demand. Previously, they did so by throttling generators or even bringing power stations on and off line. But the dwell time between step changes could take hours – not good for our desk tops at all …
Battery storage has potential to make these adjustments in nano seconds, thereby avoiding power fluctuations that plague electronic equipment. However, domestic consumers are unwilling to accept the additional costs ensuing. Hence, the rate of mass battery storage implementation depends on the cost-efficiency of batteries.
Round trip efficiency in turn depends on battery performance , as do our efforts to reduce global warming. Thus, round trip efficiency is a critical success factor for our overall progress towards a greener future.
Will New Technologies be able to Increase Solar Power Efficiency?
Battery Longevity And How Size Matters
Preview Image: Recharging an Electric Bus in Shanghai
Video Share Link: https://youtu.be/-I87Qg24tMk
About Author

I tripped over a shrinking bank balance and fell into the writing gig unintentionally. This was after I escaped the corporate world and searched in vain for ways to become rich on the internet by doing nothing. Despite the fact that writing is no recipe for wealth, I rather enjoy it. I will not deny I am obsessed with it when I have the time. I live in Margate on the Kwazulu-Natal south coast of South Africa. I work from home where I ponder on the future of the planet, and what lies beyond in the great hereafter. Sometimes I step out of my computer into the silent riverine forests, and empty golden beaches for which the area is renowned. Richard
Related Posts

Inverters and Batteries Make a Great Team

Huge Solar Battery Farms Transform Electricity

Emergency Battery Power For Stranded Trains
Leave a reply cancel reply.
Save my name, email, and website in this browser for the next time I comment.
What is Round trip efficiency?
The process of battery charging and discharging is always associated with some energy loss. Round trip efficiency is the combined loss of energy added to and withdrawn from a battery. It is given as the percentage of the energy put in. Round trip efficiency of lead-acid batteries is commonly about 75 percent. Li-ion batteries are claimed to boast a round trip efficiency of 96 percent or even higher. However, the actual value is normally lower. Thus, the round trip efficiency of Li-ion-powered Tesla Powerwall is 92.5 percent.
← Back to Solar Energy Glossary

Top Products
Top softwares, largest solar plants, top companies.
- Terms & Conditions
- Privacy Policy
- Advertisement
GridProjectIQ Documentation
Energy Storage System Efficiency
The round trip efficiency (RTE) of an energy storage system is defined as the ratio of the total energy output by the system to the total energy input to the system, as measured at the point of connection. The RTE varies widely for different storage technologies. A high value means that the incurred losses are low.
Reference Information
The typical RTE values for different technologies along with the source of information are provided below. If the reference provides a range of values instead of a single value, the median value of the range has been used.
- Lithium-ion (83%) : W. G. Manuel, “Energy Storage Study 2014”, 2014.
- Vanadium redox flow (75%) : V. Viswanathan, M. Kintner-Meyer, P. Balducci and C. Jin, “National Assessment of Energy Storage for Grid Balancing and Arbitrage, Phase II, Volume 2: Cost and Performance Characterization”, Sept. 2013.
- Sodium sulfur (75%) : W. G. Manuel, “Energy Storage Study 2014”, 2014.
- Advanced lead-acid (85%) : IEC, “Electrical Energy Storage: White Paper”, 2011.
- Flywheel (81%) : V. Viswanathan, M. Kintner-Meyer, P. Balducci and C. Jin, “National Assessment of Energy Storage for Grid Balancing and Arbitrage, Phase II, Volume 2: Cost and Performance Characterization”, Sept. 2013.
- Compressed air (50%) : IEC, “Electrical Energy Storage: White Paper”, 2011.
- Pumped hydro (81%) : V. Viswanathan, M. Kintner-Meyer, P. Balducci and C. Jin, “National Assessment of Energy Storage for Grid Balancing and Arbitrage, Phase II, Volume 2: Cost and Performance Characterization”, Sept. 2013.
Performance Analysis of Lithium-Ion Battery Considering Round Trip Efficiency
Ieee account.
- Change Username/Password
- Update Address
Purchase Details
- Payment Options
- Order History
- View Purchased Documents
Profile Information
- Communications Preferences
- Profession and Education
- Technical Interests
- US & Canada: +1 800 678 4333
- Worldwide: +1 732 981 0060
- Contact & Support
- About IEEE Xplore
- Accessibility
- Terms of Use
- Nondiscrimination Policy
- Privacy & Opting Out of Cookies
A not-for-profit organization, IEEE is the world's largest technical professional organization dedicated to advancing technology for the benefit of humanity. © Copyright 2024 IEEE - All rights reserved. Use of this web site signifies your agreement to the terms and conditions.
Thunder Said Energy
the research consultancy for energy technologies

Round Trip Battery Efficiencies
This data-file derives the ‘net round trip efficiency’ of nine different battery solutions for storing energy. Rough costs are also estimated.
Net round trip efficiency is calculated as the energy efficiency of the battery (kWh recovered per kWh fed in) divided by the energy efficiency of the displaced energy source.
We see great potential in “good batteries” , for example, electrification of the vehicle fleet, which can achieve c3.5x uplifts in efficiency. We see less potential in “bad batteries”, for example, backing up the grid with hydrogen, which reduces total system efficiency by c35%.
Privacy Overview
Election latest: Rishi Sunak questioned on 'catalogue of broken promises' - as Sir Keir Starmer likened to 'political robot'
Rishi Sunak and Sir Keir Starmer are grilled by political editor Beth Rigby and face questions from a live audience.
Thursday 13 June 2024 06:40, UK
- General Election 2024
Please use Chrome browser for a more accessible video player
Battle For No 10 - Sky News leaders' event
- Catch-up: The main things you need to know after Beth Rigby and studio audience question Sunak and Starmer
- Almost two-thirds of voters think Starmer did better - poll
- View from the spin room: How parties thought their men got on
- Beth Rigby: There is a change in dynamic here
- Jon Craig: Starmer raised his game - and Sunak looked flat
- Live reporting by Charlotte Chelsom-Pill, Emily Mee , Katie Williams and Faye Brown
Did Sunak revive chances?
- PM admits 'it hasn't been an easy 18 months'
- Sunak says 'he was right' to oppose Liz Truss' policies
- Rigby points to Brexit and NHS in 'catalogue of broken promises'
- Analysis: Sunak has mountain to climb after D-Day gaffe
How did Starmer fare?
- Labour leader denies ditching most of his previous pledges
- Starmer challenged over prior positions on Corbyn and Brexit
- And he reveals 'only fear' about potentially becoming PM
- Fact check: Campaign promises in spotlight | Is a tax rise on cards?
Election essentials
- Check parties' manifesto pledges: Conservatives | Greens | Lib Dems
- Campaign Heritage: Memorable moments from elections gone by
- Trackers: Who's leading polls? | Is PM keeping promises?
- Follow Sky's politics podcasts: Electoral Dysfunction | Politics At Jack And Sam's
- Read more: Who is standing down? | Key seats to watch | How to register to vote | What counts as voter ID? | Check if your constituency is changing | Your essential guide to election lingo | Sky's election night plans
Good morning!
Welcome back to the Politics Hub on day 22 of the fight for the keys to No 10.
We are precisely halfway through the general election campaign, with polls opening in exactly three weeks - hasn't time flown?!
After both men hoping to lead the country for the next five years faced a grilling from Sky's Beth Rigby and our live audience in The Battle for Number 10 , they both have busy days ahead as we enter the second half of the race.
Here's what's happening today:
- The Labour Party is launching its manifesto this morning at an event in Greater Manchester, with Sir Keir Starmer and his team due to unveil their plans for the next five years;
- The party has promised it will have "wealth creation" at its heart, and they are pitching a potential Labour government as both "pro-business and pro-worker";
- The manifesto launch will be a chance for Sir Keir to convince floating voters by outlining more detail on Labour's plans for power - though a party source told Sky News it would be a "slim" document;
- Plaid Cymru is also unveiling their manifesto this morning, with the party pledging to "fight for economic fairness" and secure "fair funding" for Wales;
- The party say Wales is owed "billions" after HS2 was scrapped, and the funding model is currently not "fair";
- They will unveil their plans around protecting devolution, more investment in the NHS, and assistance for families amid the ongoing cost of living crisis;
- Rishi Sunak , meanwhile, has jetted off to Italy for the G7 summit as the essential business of government continues amid the campaign;
- The government has confirmed that a £240m aid package will be provided to Ukraine, to be used for emergency humanitarian aid and to rebuild critical energy infrastructure targeted by Russian bombing, as well as wider reconstruction;
- This is not new money, however - it is part of the £2.5bn aid package announced by the PM on a trip to Kyiv in Ukraine;
- On the campaign trail, the Conservative Party is highlighting its commitments on security, including raising defence spending to 2.5% of GDP;
- Elsewhere, the Lib Dems , SNP , the Green Party , and Reform UK are expected to be out and about this morning ahead of another debate tonight - with deputies and leaders due to take to the stage in another multi-party contest.
We'll be discussing all of that and more with:
- Wendy Chamberlain , deputy leader of the Scottish Lib Dems, at 6.45am ;
- Wes Streeting , shadow health secretary, at 7.15am ;
- Lord Cameron , foreign secretary, at 8.10am .
Following along for live coverage of the day on the general election campaign.
Thanks for joining us for what's been a massive night in the campaign calendar as Sky hosted The Battle for Number 10.
It saw Rishi Sunak and Sir Keir Starmer scrutinised by political editor Beth Rigby and audience members in Grimsby.
We are pausing our coverage here for the evening.
But if you missed anything - or just can't get enough - you can scroll back through our minute-by-minute updates below.
You can also check out our summary of the key moments here:
Take a look at our recap of the leaders' responses on the main issues facing the country here:
Plus, you can see how viewers thought both leaders performed here:
We will be back first thing tomorrow morning for another busy day, with Labour next in line to launch their election manifesto.
Until then, goodnight!
By Faye Brown , political reporter, in Grimsby
The first audience member to ask a question tonight was Sharon from Grimsby.
I caught up with her afterwards and she tells me she was generally happy with the Labour leader's answer on her question about what he could do for the local community, such as devolution, but there's more that needs to be done to tackle poverty.
She says she is very involved in her community and has seen first hand the impact of austerity - from people choosing between heating and eating, to parents relying on uniform banks and "diabolical" housing conditions.
She says she has always been a Labour voter, but her support for Sir Keir is "strengthened" after tonight.
She says she's glad Sir Keir has changed the party and realised "he needs to put the country first" - so she isn't angry about the U-turns he has made on on many of his leadership pledges.
"I appreciate the honesty, there are going to be tough decisions".
She says her message to the Labour leader is, "we're giving you a chance, don't waste it".
"I am just hoping we get that change that is so needed and we can start to look forward to positive change.
"Local people being able to make decisions about their local towns, that's really important."
At this point, we are all aware that Sir Keir Starmer's dad was a toolmaker.
He has brought it up on plenty of occasions, including during the first election debate - and tonight, when the comment earned some laughter from the audience.
Asked why people may have laughed at this, Labour MP Jonathan Ashworth said: "Perhaps because they know that he talks about it quite a lot but, as he said, he's very proud of coming from that working class background, as I'm very proud of coming from a working class background as well.
"And I think the issue in politics is when politicians try to pretend they were hard up when they weren't, perhaps saying that they didn't have access to this new thing called satellite TV back in the 1990s as if that somehow indicates they were short of a few bob."
That last comment is a reference to Rishi Sunak earlier saying he went without Sky TV as a child.
By Faye Brown, political reporter
Lauren Smith, 35, says that overall she was impressed by Sir Keir Starmer this evening and he will be getting her vote.
But she said she felt frustrated by both leaders for their "Americanised style" - something she described as a "lack of want or ability to answer a question straight on".
"After what the country has been through, we need someone to be able to answer a question," she says.
"I would like to see them stand true to themselves and to their word... and show us a bit of respect."
She says Rishi Sunak in particular is "treating us like idiots" with his comments on the cost of living - saying that while inflation is coming down, the cost of things is not.
And Lauren has seen first hand the impact of this. She lives on the East Marsh in Grimsby - "one of the poorest wards in Britain".
"The deprivation is incredulous... the poverty, it's the consequence of so much austerity," she says.
She says she has always leaned towards Labour and while she thinks there are things Sir Keir can do better she has a fondness for him that "remained resolute" after tonight.
"He's our best chance of getting a grown up in politics. Not too centre, not too left".
And she says that this seemed to be the overall vibe from the audience too, saying that despite efforts to "soundproof the room" she could hear people outside "booing Mr Sunak quite ferociously" when he arrived.
She points to the revolving door of recent Tory leaders that Beth Rigby touched upon in her questioning.
"We have had enough. We are struggling, we need change we can believe in. We've had a complete roller-coaster and we need something steady."
Scotland's deputy first minister Kate Forbes says Scottish voters are angry at the Conservatives and uninspired by Labour following the Sky News leaders' event.
Neither Sir Keir Starmer or Rishi Sunak gave much attention to Scotland during their time on stage being grilled by Sky News political editor Beth Rigby or when taking questions from the audience.
Asked by Sky's lead politics presenter Sophy Ridge who she thought performed best in Grimsby, Forbes said: "I think looking at the debate this evening with only a passing mention of Scotland, voters are very angry with the Conservatives and they're very uninspired with Labour.
"And of course, in Scotland there is an alternative to vote for the SNP."
She continued: "We know that in this election voters really want to see change. They want to get rid of the Conservatives because they've given us austerity, Brexit and the cost of living crisis.
"And the question is whether Labour will double down on Tory austerity or do something different. And Sir Keir Starmer seemed pretty clear tonight that he was doubling down on Tory austerity."
Tonight's event saw Sir Keir pushed to explain his tax plans, saying he "won't reach for the tax lever" to solve Britain's problems.
Asked by Ridge whether she thought Labour would go ahead and put up taxes if Sir Keir reached Number Ten, Forbes said: "In Scotland we've tried to mitigate against that austerity with some progressive changes, taxation.
"But Labour seem to be completely ignorant and disinterested in how we reverse 14 years of austerity to our public finances.
"And to quote the Labour health secretary when it comes to devolved public services - 'all roads lead back to Westminster', so this really is a change election.
"Unfortunately, I don't think voters going down the Labour route are going to see much in the way of change, and we need strong Scottish voices, SNP MPs to hold Labour's feet to the fire and make sure they don't forget about Scottish voters."
I've just caught up with Amy Green, 42, an undecided voter who is.. still undecided after tonight's event.
Amy was the audience member who asked Rishi Sunak questions about his D-day gaffe and the partgate scandal, telling him he had a lot of work to do to regain the people's trust again.
Did he regain her trust tonight?
Amy says she has always been a Conservative voter but the prime minister appeared "really defeatist".
However she feels like Labour are "parking their tanks in the Conservatives lawn" and she's not quite convinced by their vision either.
"It felt like more of the same".
I ask Amy what are the issues she cares about most.
She says LGBT rights, as she has lots of friends who are drag queens, and she does not like the "cheap political point scoring" from the Tories about knowing what a woman is.
Education and the NHS are the other two main issues for her.
She's going to see how the rest of the campaign pans out, but she said she is "not against spoiling her ballot".
"I would rather do that and not vote, I've got some work to do in the next few weeks".
Sky's political editor and leaders' event inquisitor Beth Rigby says there was a key moment tonight which showed "there is a change of dynamic here".
She is giving her take after having a front-row seat to Rishi Sunak and Sir Keir Starmer's performances.
During Sir Keir's Q&A session Beth says he said categorically " when I'm in government".
Usually, Beth says, Sir Keir will caveat his take on the outcome of the election by saying " if I'm lucky enough" to win.
She describes it as the "most revealing moment" from the Labour leader.
"I think there is a change in dynamic here where Labour are feeling more confident now," Beth says.
She also says there was a "bit more clarity about Labour and tax", and that she "came away thinking yeah, they're going to put up some taxes".
On Rishi Sunak, Beth says the audience dynamic in the room was "hard going" for the prime minister as he made his first big public appearance since the fiasco over him leaving D-Day commemorations early.
We got "more emotion" from Mr Sunak about the D-Day commemoration, she says, adding that one of the strongest audience questions came from a "lifelong true blue" voter who said his early departure make her feel "ashamed”.
Asked by Sophy Ridge how she prepared for tonight's event, Beth cites Sky's very own Kay Burley .
She says Kay's advice to her has been "fail to prepare, prepare to fail".
"I prepared a lot," she says, "so by the time you get to it, you're ready to go".
The Liberal Democrats' deputy leader Daisy Cooper says tonight's audience in Grimsby and the public at home could see through Rishi Sunak's answers during the Sky News leaders' event.
Asked by Sky's lead politics presenter Sophy Ridge who she thought won the Battle for Number 10, Ms Cooper said the audiences' reaction to the PM told the tale of the tape.
She said: "I think the audience's reaction spoke volumes about this evening, didn't it? And when they were listening to Rishi Sunak's answers, you could see it in their faces and in their questions.
"Their reaction was one of either exasperation or just pure anger. And I think we can see that people were just so exasperated and angry about the state of the country, about the state of the NHS, about the state of our education system.
"And there was this overwhelming sense from the public that just everything is broken."
As for her thoughts on Sir Keir Starmer and his grilling from Beth Rigby over Labour's tax policy, Ms Cooper said she was expecting more tomorrow once the opposition's manifesto was released.
"I think every political party needs to be open and honest about the taxes that they are going to rise or lower or leave the same," she added.
"What I can say for our poll as Liberal Democrats is that we have said repeatedly that we won't be raising taxes on struggling families during a cost of living crisis, because that would be the wrong thing to do.
"Like many people, I'm sort of waiting to see what the what the meat on the bones is going to be tomorrow in terms of their manifesto.
"But I think really what the what you can see from the audience is that they are crying out for a change and most of their anger and frustration was really directed towards the prime minister."
By Faye Brown , political reporter
I've just been catching up with members of the audience to get their views on tonight's event.
Jackie Weavill, who shouted out at Mr Sunak during his questioning on the NHS, said she felt compelled to take him to task as his comments about investing into NHS hubs were not the reality she is seeing on the ground.
The NHS quality governance manager says her whole family works for the NHS, and she sees every day the problems it is facing.
She says there are "nursing shortages, staff are sick, they're mentally at their wits end, fighting battles every day, doctors especially the young ones really get hammered".
She says Rishi Sunak thinks "it's going to be sunshine and roses".
"It might be for the big cities but not it's not here," she adds.
Even so, she's a "Conservative through and through" and will vote for them at the election out of her loyalty to the party and because she "doesn't trust Labour".
"They left areas like this destitute when they were last in government," she says.
But in true northern style she does not mince her words when asked what her message would be to Rishi Sunak.
"Pick something and do it. Don't fanny around, say what you are going to do and do it.
"Step up and stick to your guns."
Be the first to get Breaking News
Install the Sky News app for free

Do something for our planet, print this page only if needed. Even a small action can make an enormous difference when millions of people do it!
All official European Union website addresses are in the europa.eu domain.
Try our suggestions
Europe’s air quality status 2024, key messages.
- Despite ongoing overall improvements in air quality, current EU standards are still not met across Europe.
- 96% of the EU’s urban population is exposed to unsafe concentrations of fine particulate matter (PM 2.5 ).
- The new EU air quality standards introduced in the revised ambient air quality directive — proposed to come into force in 2030 — are more ambitious than the current ones.
This briefing is one in a series to be published by the EEA as part of the Air quality in Europe 2024 package.
It assesses concentrations of air pollutants in ambient air across Europe, comparing them against current EU standards and the 2021 WHO global air quality guidelines . The EU standards were set out in the 2004 and 2008 ambient air quality directives .
Under the European Green Deal (EGD)’s zero pollution action plan , the European Commission set the interim 2030 goal of reducing the number of premature deaths caused by fine particulate matter (PM 2.5 , a key air pollutant) by at least 55% compared with 2005 levels. The ultimate objective is for air pollution to have no significant impact on health by 2050. To this end, the Commission published a proposal to review the ambient air quality directives in 2022. Among other things, it aimed to align the air quality standards more closely with WHO recommendations.
Co-legislators agreed to more ambitious EU air quality standards in February 2024. However, they are still less strict for all pollutants than what the WHO outlines in their air quality guideline levels .
In 2022, despite ongoing reductions in emissions , most of the EU’s urban population continued to be exposed to levels of key air pollutants that are damaging to health (see Figure 1). In particular, almost all of the urban population was exposed to concentrations of PM 2.5 above the 2021 WHO annual guideline level of 5µg/m 3 and to concentrations of ozone (O 3 ) above the short-term guideline level of 100µg/m 3 .
Figure 1. Share of the EU urban population exposed to air pollutant concentrations above certain EU standards and WHO guidelines in 2022

Notes : Exposure above EU standards: the EU urban population is exposed to PM 2.5 annual concentrations above 25µg/m 3 ; PM 10 daily concentrations above 50µg/m 3 for more than 35 days per year; O 3 maximum daily 8-hour mean concentrations above 120µg/m 3 for more than 25 days per year; NO 2 annual concentrations above 40µg/m 3 ; Benzo[a]pyrene (BaP) annual concentrations above 1ng/m 3 ; and sulphur dioxide (SO 2 ) daily concentrations above 125µg/m 3 for more than three days per year. Exposure above WHO guidelines: the EU urban population is exposed to PM 2.5 annual concentrations above 5µg/m 3 ; PM 10 annual concentrations above 15µg/m 3 ; O 3 maximum daily 8-hour mean concentrations exceeding 100µg/m 3 for more than 3-4 days per year; NO 2 annual concentrations above 10µg/m 3 ; BaP annual concentrations above 0.12ng/m 3 ; and SO 2 daily concentrations above 40µg/m 3 for more than three or four days per year. Source : EEA, 2024 .
Methodology
This analysis highlights pollutants deemed most harmful to human health and those that most frequently exceed the current EU air quality standards and WHO guideline levels.
The concentrations are obtained from monitoring station measurements and are officially reported to the EEA by its members and other collaborating countries [1] . The classification of the monitoring stations and the criteria used to determine their inclusion in the analysis are described here . The number of countries that submitted data and the number of monitoring stations with the minimum data coverage required vary for each pollutant. This is summarised in Table 1 for 2022 and Table 2 for 2023. When referring to countries reporting data above certain levels, it means that they reported at least one station with concentrations that surpassed them.
Data for 2022 and 2023 were extracted from the EEA’s reporting system on 5 March 2024.
The analysis for 2022 is based on officially validated data reported by countries. The analysis for 2023 is based on provisional up-to-date (UTD) data. It may change once fully validated data is received by the EEA and more countries are considered. Validated data for 2023 will only be available later in 2024 and will be presented in the 2025 briefing.
Additional information and further analysis are available in the Eionet status reports ETC/HE 2024/3 (Targa et al., 2024a) and ETC/HE 2024/5 (Targa et al., 2024b), prepared by the European Topic Centre on Human Health and the Environment (ETC HE) .
Further information on the concentrations of air pollutants, including those for previous years, can be found at the EEA’s statistics viewer . Data can be downloaded here .
Apart from the measurements from monitoring stations, some countries also reported 2022 official data from modelling applications, which are available from the Air Quality Modelling Viewer . The results from these modelling applications have been included in this analysis where they implied concentrations above the EU standards.
Navigate the tabs for information on each pollutant:
- Other pollutants
PM 10 stands for particulate matter with a diameter of 10µm or less. PM 10 is emitted mainly by the combustion of solid fuels for domestic heating, although industrial activities, agriculture and road transport are also important sources. Some also come from natural sources such as sea salt, Saharan dust or volcanoes, and some (secondary PM) form in the atmosphere as a combination of different gases (for instance, ammonia and nitrogen dioxide). Member States can discount the contribution of natural sources to the total concentrations for compliance assessments as these sources are out of their control, but we do not exclude these sources in this status analysis.
Concentrations above the EU daily limit value for PM 10 are seen mainly in Italy and some eastern European countries (Map 1 and Figure 3). In most central and eastern European countries, solid fuels such as coal and wood are widely used for heating households and in some industrial facilities and power plants. The Po Valley in northern Italy is a densely populated and industrialised area with specific meteorological and geographical conditions that favour the accumulation of air pollutants in the atmosphere. Some concentrations are also above the EU daily limit value in southern Spain and the Canary Islands, mainly due to the natural contributions of Saharan dust ( MITECO, 2023 ).
Map 1. Concentrations of PM 10 in 2022 and 2023 in relation to the EU daily limit value
Note: The map shows the 90.4th percentile of the PM 10 daily mean concentrations, representing the 36th-highest value in a complete series. It is related to the PM 10 daily limit value, allowing 35 exceedances of the 50µg/m 3 threshold over one year. Source: EEA’s AQ e-reporting database.
Table 3. Country status for PM 10 in 2022 and 2023
Note: ( a ) all the reporting countries; ( b ) all the reporting countries except Estonia and Iceland; ( c ) all the reporting countries except Luxembourg. Source: EEA’s AQ e-reporting database.
Figure 2. Percentage of reporting monitoring stations registering PM 10 concentrations above the EU limit values and the WHO guideline levels in 2022 and 2023

In 2022, 16% of monitoring stations measured concentrations of PM 10 above the EU daily limit value (Figure 2), 84% of which were urban and 12% suburban.
Furthermore, Italy and Poland reported 2022 exceedances of the PM 10 daily limit value based on assessment models for 7 and 13 air quality zones, respectively.
Figure 3. PM 10 concentrations in 2022 by country in relation to the EU daily limit value
Note: The figure shows, per country, the concentrations of each reported station; the minimum and maximum concentrations; the median and the 25th and 75th percentiles of all the measurements (90.4th percentile of the PM 10 daily mean concentrations).
PM 2.5 stands for particulate matter with a diameter of 2.5µm or less. These particles are emitted mainly from the combustion of solid fuels for domestic heating, industrial activities and road transport. As with PM 10 , they can also come from natural sources and can form in the atmosphere. For compliance assessments, Member States can discount the contribution of natural sources to the total concentrations as these sources are out of their control, but in this status analysis, we do not exclude them. Agricultural emissions of ammonia significantly contribute to forming fine particulate matter in the atmosphere.
PM 2.5 concentrations above the EU annual limit value were seen in Italy and some eastern European countries (Map 2 and Figure 5). As for PM 10 , solid fuel use is the main reason for the situation in central and eastern Europe, together with an older vehicle fleet. In northern Italy, the high concentrations are due to the combination of a high density of anthropogenic emissions and also meteorological and geographical conditions that favour the accumulation of air pollutants in the atmosphere and the formation of secondary particles.
Map 2. Concentrations of PM 2.5 in 2022 and 2023 in relation to the EU annual limit value and the WHO annual guideline level
Source: EEA’s AQ e-reporting database .
Table 4. Country status for PM 2.5 in 2022 and 2023
Notes : ( a ) all the reporting countries, except Iceland; ( b ) all the reporting countries. Source: EEA’s AQ e-reporting database .
Figure 4. Percentage of reporting monitoring stations registering PM 2.5 concentrations above the EU annual limit value and the WHO guideline levels in 2022 and 2023

In 2022, 2% of monitoring stations registered concentrations of PM 2.5 above the EU annual limit value (Figure 4), 78% of which were urban and 15% suburban. In contrast, 95% of the PM 2.5 reporting stations registered concentrations above the WHO annual guideline level, 76% of which were urban and 20% suburban.
Furthermore, Italy and Poland reported exceedances of the PM 2.5 annual limit value based on assessment models for three and one air quality zones, respectively.
Regarding the EU standards related to the Average Exposure Indicator [2] for PM 2.5 , which assesses the general population’s long-term exposure in urban areas, all EU Member States continued to meet the exposure concentration obligation of 20µg/m 3 in 2022, set as a 2015 target under the ambient air quality directive [3] . Furthermore, for the first time, all Member States [4] met the national exposure reduction target set for 2020.
Figure 5. PM 2.5 concentrations in 2022 by country in relation to the EU annual limit value and the WHO annual guideline level
Note: The figure shows, per country, the concentrations of each reported station, the minimum and maximum concentrations, the median and the 25th and 75th percentiles of all the measurements (annual mean PM 2.5. concentrations).
Ozone (O 3 ) is a pollutant formed in the atmosphere when heat and light cause chemical reactions between nitrogen oxides and volatile organic compounds (VOCs), including methane (which is also a powerful greenhouse gas ). Emissions of these gases occur from anthropogenic sources and, in the case of VOCs, also biogenic. Ozone is also transported to Europe from other parts of the northern hemisphere and the upper atmosphere. Meteorology plays an important role in forming and dispersing air pollution, and interannual variations in concentrations. This effect is especially significant for ozone.
Map 3. Concentrations of O 3 in 2022 and 2023 in relation to the EU target value
Notes: The map shows the 93.2nd percentile of the O 3 maximum daily eight−hour mean, representing the 26th-highest value in a complete series. It is related to the O 3 target value. Data are presented here for one year only instead of the average over a three-year period, as stated in the definition of the EU target value for O 3 . Source : EEA’s AQ e-reporting database .
The highest concentrations in 2022 were found in some Mediterranean and central European countries (Map 3 and Figure 7).
Table 5. Country status for O 3 in 2022 and 2023
Notes : ( a ) all the reporting countries. The stations in Kosovo, although reported, did not get the minimum data coverage to estimate the relevant ozone statistics. Source : EEA’s AQ e-reporting database .
Figure 6. Percentage of reporting monitoring stations registering O 3 concentrations above the EU target value and the WHO guideline levels in 2022 and 2023
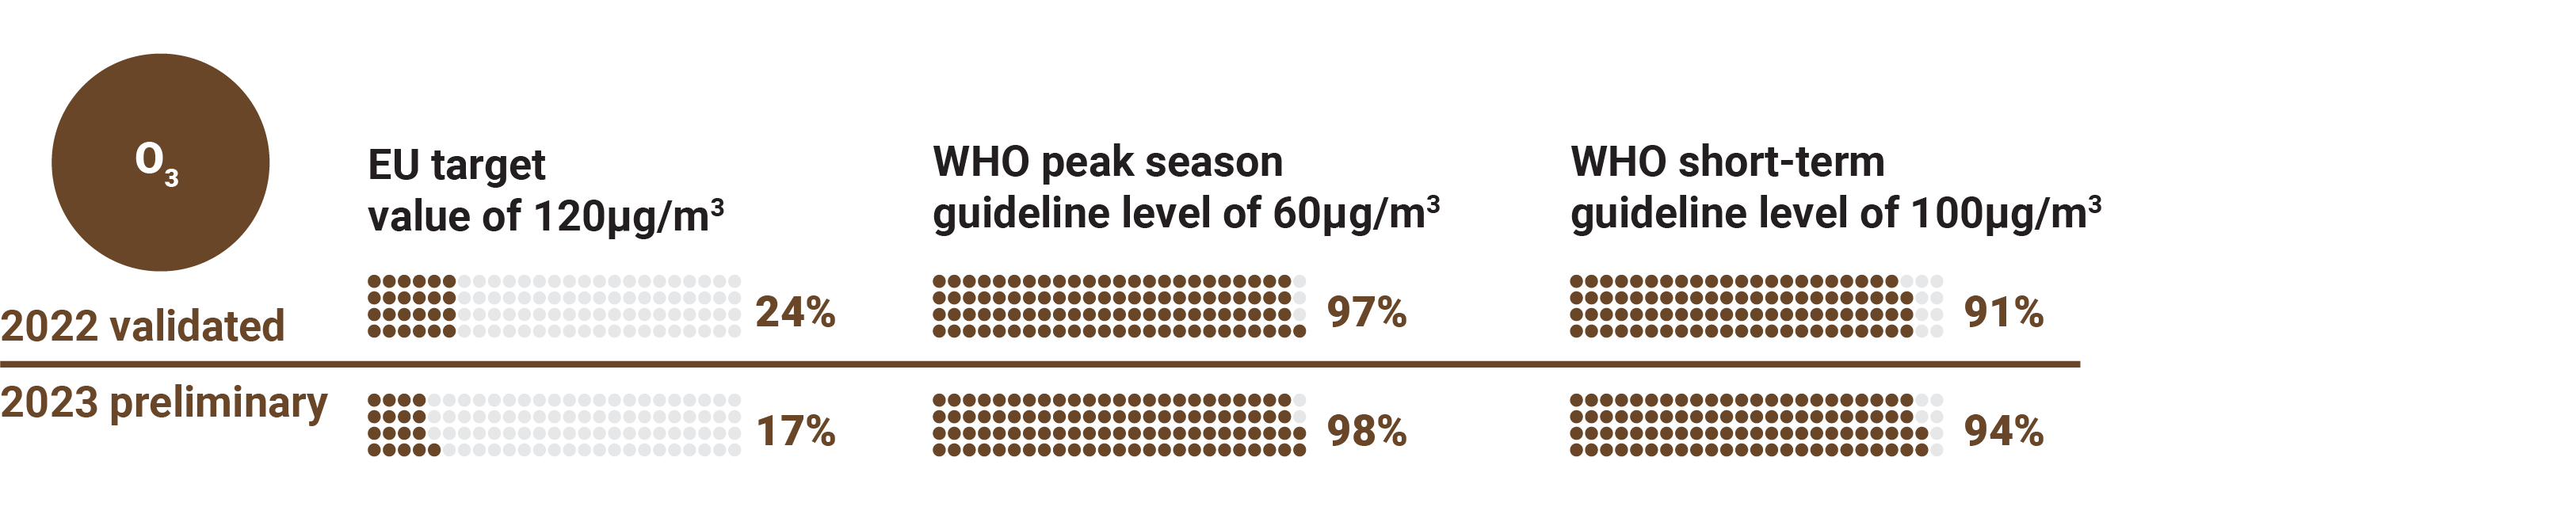
The long-term EU objective for ozone of 120µg/m 3 was met at 16% of monitoring stations in 2022.
Italy reported exceedances of the O 3 target value for the protection of health based on assessment models for three air quality zones. Italy and Poland reported exceedances of the O 3 long-term objective for the protection of health in 9 and 46 air quality zones, respectively.
Figure 7. O 3 concentrations in 2022 by country in relation to the EU target value
Note: The figure shows, per country, the concentrations of each reported station, the minimum and maximum concentrations, the median and the 25th and 75th percentiles of all the measurements (93.2nd percentile of O 3 maximum daily eight-hour mean). Data are presented here for one year only, not the average over a three-year period as stated in the definition of the EU target value for O 3 .
In 2023, the long-term EU objective for ozone was met at 14% of monitoring stations.
The leading source of nitrogen dioxide (NO 2 ) is road transport, which emits NO 2 close to the ground, mostly in densely populated areas, contributing to population exposure. Other important sources are combustion processes in industry and energy supply.
Concentrations above the annual limit value were found in many Turkish cities and some big cities with a high volume of traffic (Map 4 and Figure 9).
Map 4. Concentrations of NO 2 in 2022 and 2023 in relation to the EU annual limit value and the WHO annual guideline level
Source : EEA´s AQ e-reporting database .
Table 6. Country status for NO 2 in 2022 and 2023
Notes : ( a ) all the reporting countries; ( b ) all the reporting countries, except Kosovo; ( c ): all the reporting countries. The stations from Kosovo, although reported, did not get the minimum data coverage to estimate the NO 2 statistics related to the WHO air quality daily guideline level. Source : EEA’s AQ e-reporting database .
Figure 8. Percentage of reporting monitoring stations registering NO 2 concentrations above the EU limit values and the WHO guideline levels in 2022 and 2023

In 2022, 2% of monitoring stations registered concentrations of NO 2 above the EU annual limit value (Figure 8), 76% of which were traffic stations. Concentrations above the NO 2 WHO annual guideline level were registered at 74% of all monitoring stations, 45% of which were traffic stations.
Belgium, Italy and Poland reported exceedances of the NO 2 annual limit value based on assessment models for three, two and four air quality zones, respectively.
Figure 9. NO 2 concentrations in 2022 by country and in relation to the EU annual limit value and the WHO annual guideline level
Note: The figure shows, per country, the concentrations of each reported station, the minimum and maximum concentrations, the median and the 25th and 75 th percentiles of all the measurements (annual mean NO 2 concentrations).
In 2023, 1% of monitoring stations registered concentrations of NO 2 above the annual limit value, all of which were traffic stations. 68% of monitoring stations registered concentrations above the WHO annual guideline level, 46% of which were traffic stations.
Benzo(a)pyrene (BaP) is a carcinogenic pollutant emitted mainly from the combustion of coal and wood for heating and, to a lesser extent, from industrial installations and the combustion of agricultural waste.
The highest concentrations were found in Italy and eastern Europe (Map 5 and Figure 10), where the use of coal and other solid fuels for residential heating is widespread.
Map 5. Concentrations of BaP in 2022
Source: EEA’s AQ e-reporting database
Country status for BaP in 2022: 12 out of 27 reporting countries, all of which were EU Member States, registered values above 1.0 ng/m 3 . Concentrations above 1.0 ng/m 3 were registered at 25% of the reported monitoring stations, the majority of which were urban (78%) or suburban (18%). Greece and Poland reported exceedances of the BaP target value based on assessment models for one and 32 air quality zones, respectively.
Figure 10. BaP concentrations in 2022 by country
Note: The figure shows, per country, the concentrations of each reported station, the minimum and maximum concentrations, the median and the 25th and 75th percentiles of all the measurements (annual mean BaP concentrations).
Country status for sulphur dioxide (SO 2 ) in 2022:
- 4 out of 37 reporting countries (Bosnia and Herzegovina, Türkiye, North Macedonia and Serbia) — none of them EU Member States — registered levels above the EU daily limit value of 125µg/m 3 ;
- 17 countries, including nine EU Member States, registered values above the WHO daily guideline level of 40µg/m 3 [5] .
In 2022, 1% of reporting monitoring stations registered concentrations above the EU daily limit value and 6% of stations registered concentrations above the WHO daily guideline level.
In 2023, 11 reporting stations outside the EU (nine in Bosnia and Herzegovina and two in North Macedonia) registered concentrations of SO 2 above the EU daily limit value. In the same year, concentrations above the WHO daily guideline level were registered in 13 countries (including 10 EU Member States) out of 33 reporting countries.
Concentrations above the corresponding EU limit or target values were also registered in 2022 for the following pollutants:
- carbon monoxide (CO) at one station, located in the non-EU Member State of Serbia, out of 35 reporting countries;
- for benzene and lead, no stations reported concentrations above EU annual limit values in the 28 and 30 reporting countries, respectively. Italy reported exceedances of the benzene annual limit value based on assessment models for one air quality zone;
- arsenic in six stations across three EU Member States (Belgium, Finland and Poland, with two stations each) out of 29 reporting countries. Poland reported exceedances of the arsenic annual target value based on assessment models for two air quality zones;
- cadmium at one station, located in the EU Member State of Bulgaria, out of 30 reporting countries;
- nickel in four stations located in four EU Member States (Finland, France, Germany and Italy) out of 29 reporting countries.
[1] The 27 European Union Member States, plus Iceland, Liechtenstein, Norway, Switzerland and Türkiye. The six West Balkan countries are cooperating countries. These include Albania, Bosnia and Herzegovina, North Macedonia, Montenegro, Serbia and Kosovo (the designation is without prejudice to position on status, and is in line with UNSCR 1244/99 and the ICJ Opinion on the Kosovo Declaration of Independence). Andorra reports data on a voluntary basis.
[2] The Average Exposure Indicator (AEI) is based on a three-year average measured at urban background stations. The AEI for 2022 is based on 2020-2022. It assesses the general population’s long-term exposure in urban areas.
[3] As well as the EU-27, Iceland and Norway also reported an AEI2022 below the exposure concentration obligation. The AEI2022 estimated for Switzerland, Andorra, Kosovo, Türkiye and Montenegro was also below the exposure concentration obligation. On the contrary, the estimated AEI2022 for Serbia, North Macedonia, and Bosnia and Herzegovina was above the exposure concentration obligation.
[4] Plus Iceland and Norway.
[5] The 99.18th percentile of the daily values has been considered, meaning three days of exceedance per year.
EEA, 2024. Indicator AIR003 'Exceedance of air quality standards in Europe'
Targa, J., Colina, M., Banyuls, L., González Ortiz, A., Soares, J. (2024a). Status report of air quality in Europe for year 2022, using validated data (ETC-HE Report 2024/3)
Targa, J., Colina, M., Banyuls, L., González Ortiz, A., Soares, J. (2024b). Status report of air quality in Europe for year 2023, using validated and up-to-date data (ETC-HE Report 2024/5).
MITECO, 2023. Evaluación de la Calidad del Aire en España 2022, Ministerio para la Transición Ecológica y el Reto Demográfico Secretaría General Técnica. Centro de Publicaciones., NIPO: 665-21-045-X
Identifiers
Briefing no. 06/2024 Title: Europe’s air quality status 2024 EN HTML: TH-AM-24-009-EN-Q - ISBN: 978-92-9480-650-5 - ISSN: 2467-3196 - doi: 10.2800/5970
Related content
Interactive charts, related publications.
The country assessments are the sole responsibility of the EEA member and cooperating countries supported by the EEA through guidance, translation and editing.
Geographic coverage
Temporal coverage.
For references , please go to https://www.eea.europa.eu/publications/europes-air-quality-status-2024/europes-air-quality-status-2024 or scan the QR code.
PDF generated on 13 Jun 2024, 06:58 AM
Document Actions
Share with others.
Engineered by: EEA Web Team
Software updated on 26 September 2023 08:13 from version 23.8.18
Software version: EEA Plone KGS 23.9.14
Code for developers
Systems Status
Legal notice
Creative commons license
IMAGES
VIDEO
COMMENTS
The round trip efficiency (RTE), also known as AC/AC efficiency, refers to the ratio between the energy supplied to the storage system (measured in MWh) and the energy retrieved from it (also measured in MWh). This efficiency is expressed as a percentage (%). The round trip efficiency is a crucial factor in determining the effectiveness of ...
provide energy or ancillary services to the grid at any given time. • Round-trip efficiency, measured as a percentage, is a ratio of the energy charged to the battery to the energy discharged from the battery. It can represent the total DC-DC or AC-AC efficiency of the battery system, including losses from self-discharge and other
Round-trip efficiency is the percentage of electricity put into storage that is later retrieved. The higher the round-trip efficiency, the less energy is lost in the storage process. According to data from the U.S. Energy Information Administration (EIA), in 2019, the U.S. utility-scale battery fleet operated with an average monthly round-trip ...
Round-trip efficiency is a measure of the amount of energy put into a system compared to the amount dispatched, and is expressed as a percentage. ... meaning that approximately 30% of charge ...
Round-Trip Efficiency. Round-trip efficiency is the ratio of useful energy output to useful energy input. (Mongird et al., 2020) identified 86% as a representative round-trip efficiency, and the 2021 ATB adopts this value. References . The following references are specific to this page; for all references in this ATB, see References.
The definition of battery round trip efficiency is a fundamental concept in the realm of battery technology and energy storage. This section aims to elucidate the battery round trip efficiency definition and its relevance in practical applications.
Round trip efficiency is a measure of the energy storage system's overall efficiency, considering both charging and discharging of the battery. It is the ratio of the electrical energy output from the battery to the electrical energy input to the battery during charging. In layman's terms, it is the energy a battery retains after charging ...
RTE varies among different types of storage batteries. For older battery systems, 80% round trip efficiency would have been considered a good standard. Some evidence suggests the typical lithium-ion battery - a popular choice for modern battery energy storage systems and electric vehicles - has round trip efficiency of around 83%. GivEnergy ...
Definition: The bottom-up cost model documented by (Ramasamy et al., ... Round-Trip Efficiency. Round-trip efficiency is the ratio of useful energy output to useful energy input. (Mongird et al., 2020) identified 86% as a representative round-trip efficiency, and the 2022 ATB adopts this value. In the same report, testing showed 83-87% ...
The performance of a solar + storage system is tied to the round-trip efficiency of the entire system — how many electrons are captured and then lost along the journey from the sun to the batteries to the outlets of a home? The efficiency of that system can vary depending on how it is designed and which inverter (s) and batteries are involved.
This is the charge-discharge cycle, the "round trip". In each conversion, energy is partially lost from the cycle and dissipated into the surroundings, and the efficiency of conversion at every step accounts for those losses. ... These numbers mean the following. For example, out of 1 MWh of energy spent to pump water up to the hydro storage ...
The round-trip energy efficiency of GES system is calculated by dividing the energy output (turbine mode) by the energy input (pumping mode). The round-trip efficiency ranges generally between 70 % and 80 %. It takes values inferior to 100 % due to the different losses occurring within the system. The objective of this study is to assess the ...
At last month's RE+ national clean energy industry event, two US-based engineering, procurement and construction (EPC) companies offered their views after evaluating numerous non-lithium technologies. Round-trip efficiency of alternative storage technologies is the standout metric for assessing their potential versus lithium-ion.
Comparing Round Trip Efficiency in Energy Storage. Battery storage saves surplus energy by absorbing it, and releasing it later typically to a power grid. However, the process itself expends some of the power. ... This ratio is critical to the success of energy storage, and by definition renewable energy sources too. We would be on the back ...
Round trip efficiency is the combined loss of energy added to and withdrawn from a battery. It is given as the percentage of the energy put in. Round trip efficiency of lead-acid batteries is commonly about 75 percent. Li-ion batteries are claimed to boast a round trip efficiency of 96 percent or even higher. However, the actual value is ...
Energy Storage System Efficiency. The round trip efficiency (RTE) of an energy storage system is defined as the ratio of the total energy output by the system to the total energy input to the system, as measured at the point of connection. The RTE varies widely for different storage technologies. A high value means that the incurred losses are low.
Recent times have witnessed significant progress in battery technology due to the growing demand for energy storage systems in various applications. Consequently, battery efficiency has become a crucial aspect of modern battery technology since it directly influences battery performance and lifespan. To guarantee the optimal performance and longevity of batteries, it is essential to measure ...
Round-trip Efficiency: It is the percentage of energy delivered by the BESS during discharging when compared to the energy supplied to the BESS during charging. Flow battery technology has lower round-trip efficiency compared to Lithium-ion batteries. ... Usable Energy: For the above-mentioned BESS design of 3.19 MWh, energy output can be ...
Round-trip efficiency is the percentage of electricity put into storage that is later retrieved. The higher the round-trip efficiency, the less energy is lost in the storage process.
However, while round-trip conversion efficiency of power-to-power is lower than with batteries and electrolysis can be expensive, storage of the fuels themselves is quite inexpensive. [ citation needed ] This means that large amounts of energy can be stored for long periods of time with power-to-power, which is ideal for seasonal storage.
The paper has discussed round-trip efficiency (η round-trip) as the critical figure of merit to determine the viability of an energy storage system. The aim of the study is to offer a comprehensive analysis of the options available for each of the systems implied in a P2P-mGT, using round-trip efficiency as the figure of merit for comparison.
This data-file derives the 'net round trip efficiency' of nine different battery solutions for storing energy. Rough costs are also estimated. Net round trip efficiency is calculated as the energy efficiency of the battery (kWh recovered per kWh fed in) divided by the energy efficiency of the displaced energy source.. We see great potential in "good batteries", for example ...
Related to Round-Trip Efficiency. Energy efficiency means the ratio of output of performance, service, goods or energy, to input of energy;. Motor-driven cycle means every motorcycle that has a gasoline engine that (i) displaces less than. Energy efficiency program means a program that reduces the total amount of electricity that is. Yearly (1/Year) sampling frequency means the sampling shall ...
President Biden's economic plan is supporting investments and creating good jobs in key sectors that are vital for America's economic future and national security. China's unfair trade ...
A poll has found Reform's Nigel Farage would be the favourite to take over as Tory leader if Rishi Sunak loses the election. Labour says the Conservatives are already battling over the succession.
Air pollution is Europe's largest environmental health risk, causing cardiovascular and respiratory diseases that impact health, reduce quality of life and cause preventable deaths. This briefing presents the status of regulated pollutants in ambient air in 2022 and 2023 in relation to current EU air quality standards and World Health Organization (WHO) guideline levels.